


Executive Summary
The Bionutrient Institute (formerly the Real Food Campaign) seeks to understand the variation in nutrient density in the food supply, connect nutrient outcomes to soil health and management practices, and use the results to develop market-based incentives for producers to improve their crops. Prior to 2020, the Bionutrient Institute (BI) focused on specialty crops such as carrot, grapes, kale, and spinach. In 2020, with support from Bank of America, the BI and Pipeline foods partnered to expand the BI crop suite to include wheat and oats. This increases the impact of the Bionutrient Institute, as these crops cover much a greater total acreage of US cropland than previous BI crops, as well as making up a larger percentage of US diets.
In this study, we analyzed 298 wheat and 372 oat samples for protein, total antioxidants, polyphenols, and mineral content as measures of nutrient density. The BI worked with producers to source over half of the grain samples directly from 45 farms across 13 states. Our partners also submitted soil samples and detailed management practices associated with their crops. Soil samples were analyzed for carbon content, respiration, and pH to predict soil health. The reflectance spectra for all grain and soil samples were also recorded with the Bionutrient Meter, a handheld UV/VIS colorimeter, and the SiWare Neospectra, a benchtop NIR spectrometer.
Variation in wheat and oat analytes measured in the BI lab. Variation is represented as the ratio of maximum to minimum values for each analyte.
Nutrient density analysis of these samples revealed large variation in wheat and oat quality across the US food supply chain (below). Protein content in oats and wheat showed three- to five-fold variation, meaning that the highest protein sample had up to five times more protein than the lowest sample. Antioxidants, polyphenols, and many minerals showed even larger variation, between 5x and 40x, and zinc content varied by over 60x. This variation indicates an opportunity for market-based solutions that incentivize producers to increase nutrient density in their crops.
Variation in nutrient density is caused by numerous factors, some which are out of farmer’s control, like climate and soil type, and some that farmers can control. For example, farmers choose which crop varieties to plant, how to manage their crops, and make decisions to build and maintain soil health.
Evaluating the impact of farm management practices on nutrient density outcomes in crops is complex. Often when a management practice increases the concentration of one nutrient, it reduces the concentration of another. To better identify trends across all of the nutrients measured by the BI, we have developed an index value--Bionutrient Quality Index (BQI)--to aggregate these effects into a single parameter. The definition of this value, described in more detail in the following report, is still in development with the help of a community of food scientists, nutritionists, and other experts.
Impact of regenerative management practices on the Bionutrient Quality Index of grains compared to a non-regenerative reference set of samples
Producers who identified their practices as regenerative showed increased nutrient density (BQI) compared to those that did not (above). In addition to increasing nutrient density, no-till practices also increased soil carbon sequestration. Furthermore, breaking out grain samples into “light” and “heavy” tillage allowed for a deeper examination of the impact of soil disturbance on nutrient density and soil health outcomes. Tillage that disturbed more than six inches of soil (heavy tillage) reduced nutrient concentrations in grains and carbon content in soil compared to lighter tillage.
As part of our mission to identify variation in soil health and soil carbon, we looked closely at which practices increased soil carbon content at multiple levels. Other regenerative practices such as using organic amendments increased soil carbon content, but the impact on nutrient density was less clear. This lack of clarity is often driven by a scarcity of samples for any given management practice. To examine these relationships further, we made predictions of individual crop nutrients using only the soil parameters measured by the BI lab (below). In oats, these predictions had both high R² values (0.73 – 0.9) and tightly fit a 1:1 trendline, strongly suggesting that soil carbon, respiration and pH are drivers of nutrient density outcomes. Taken together, this data suggests that practices that increase ecosystem services can also increase nutrient density outcomes. However, turning these findings into market-based incentives requires a low-cost way of predicting carbon in soil and nutrient density in grains.
Predicting nutrient concentrations in oats using the soil parameters measured by the BI lab (soil carbon, soil respiration and pH). The strength of the prediction models reflect a significant relationship between soil properties and nutrient density outcomes

Actual values for each nutrient, determined in the lab
We tested a suite of prediction models using different combinations of reflectance spectra from the Bionutrient Meter and SiWare spectrometer, combined with metadata from producers, to identify low-cost, field-deployable models for soil carbon and nutrient density. Additionally, we were able to deploy beta prediction models for nutrient content in wheat and oats. These models showed good but not exceptional accuracy (in the 60-80% range). With further research and development, these models could be optimized to provide more accurate results.
To do that, we need to expand our data library to fill in the information gaps from the 2020 season. Filling in these gaps would have the benefits of both improving the quality of our prediction models and expanding our library of practices, varieties and inputs and their effect on nutrient density. This library could be a rich source of decision support for farmers across the country, and help inform the structure of influential market-based incentives.
Recommended Next Steps
Build and expand the nutrient density library for wheat and oats by continuing to collect and analyze management data and grain and soil samples from across the US. Additionally, target recruitment of grower partners to fill in the management and data gaps identified in this report.
Increase the soil parameters measured by the BI lab to more deeply investigate the relationship between soil health and nutrient density.
Continue to deploy and test the soil carbon and nutrient density prediction models developed in this study. This includes extending the small grains program to add a subset of participating farmers who would deploy these models in the field, then evaluate model performance against BI lab tests.
Introduction
The Bionutrient (BI), a project of the Bionutrient Food Association, is a collaborative project that works to increase transparency of nutrient density in the food supply and connect nutrient outcomes to soil health and management practices. To do this, the BI is focused on four primary outcomes:
Determine the amount of variation in nutrition in the food supply.
Relate soil health and nutrient density outcomes to crop and soil management practices.
Predict nutritional parameters in produce using spectral data and metadata.
Build a public library of crop nutrition and soil and crop management data.
In the context of this project, nutrient density relates to the nutritional content of the same crop from different sources. How nutritious is one bushel of wheat grown under condition X compared to one bushel of wheat grown under condition Y? In 2018 and 2019, the BI worked with hundreds of farmers and analyzed thousands of food and soil samples for a series of specialty crops including carrots, cherry tomatoes, kale, lettuce, spinach and grapes. Over the course of those two years, the BI found a wide variation in the nutrient density of crops across the food supply chain, with some carrots having ten or even 100 times more nutrients than other carrots.
The BI has also found that farm practices that increased soil health also tended to increase nutrient density outcomes in crops. This suggests that at a landscape scale, pushing industries and markets to appropriately value nutrient-dense food could also incentivize growers to use practices that increase soil health and sequester atmospheric carbon. The end result is a more holistic system that increases the health of people, soils and ecosystems.
In 2020, Pipeline Foods partnered with the BI to expand its crop list to include wheat and oats. These two organizations share the goal of establishing a practical, empirical, and measurement-based definition of nutrient density in grain crops. Adding grains to the suite of crops in the BI’s nutrient library markedly increases our ability to answer core questions and better understand variation, and to fulfill our goals of providing responsive, contextualized nutrient density results to farmers. This project was designed with the following objectives in mind:
Expand public knowledge of nutritional density in grains.
Provide Pipeline Foods with a useful service it can use to recommend improvements for farmer partners based on a better understanding of crop nutritional density and soil health.
Supply farmers with information they can use to differentiate their products in the marketplace.
Predict soil carbon using low-cost methods like reflectance spectroscopy for use on farms.
Objectives
To meet the project goals laid out above, the BI and Pipeline Foods needed to complete the following objectives:
Update lab methods:
Modify current BI lab methods to include processes for analyzing wheat and oat and evaluate the potential to add additional analytes.
Sample and Data Collection:
Recruit Pipeline Foods farmer partners nationwide to submit wheat and oat samples to the BI lab. The BI staff trained and supported participating farmers to collect samples and complete detailed crop management questionnaires, which are a core component of BI’s public crop nutrient library.
Examine the factors affecting nutrient density outcomes:
Identify relationships between nutrient density outcomes in grains, soil health outcomes, farm practices, environmental variables and genetic diversity. Increasing our understanding of these relationships will provide tools that Pipeline Foods can use to better support its farmer members.
Predicting grain quality and soil carbon:
Use the BI’s low-cost spectroscopy tools and sample metadata (practices, climate region, cultivar, etc) to develop models so that farmers can predict grain quality to differentiate their products and predict soil carbon to understand how practices affect ecosystem services.
Upating BI Lab Methods

The BI Lab is designed to be a high throughput, low-cost lab, allowing the BI to get a snapshot of the nutrient density of thousands of food samples from across the country every year. To meet this goal, the BI needs to identify and perform lab tests which are inexpensive (low capital cost, low ongoing cost), capture the broadest perspective on quality (classes of compounds rather than individual compounds), and tend to correlate with easier-to-measure parameters like spectral reflectance.
Meeting the requirements of this project required both modifying existing lab processes to work with wheat and oats, and evaluating the feasibility of adding additional tests to the BI standard lab processes for grains.
Modifying Existing Methods
In 2019, the BI lab processes were developed for a variety of produce samples including carrot, cherry tomato, grape, kale, lettuce and spinach. These foods have a very different composition than grain samples, which have a much lower water content. Therefore, the BI lab needed to modify many of the existing protocols to be appropriate for wheat and oats. The following modifications to lab processes were completed in the summer of 2020:
Adding a dehulling step to lab processing.
Assessing expected antioxidant and polyphenol content in wheat and oats to develop new extraction and dilution thresholds for these crops.
Replacing the “juicing” method used in fruits and vegetables with grinding as an inexpensive and replicable method to process and homogenize samples for spectral scanning.
Examining New Methods
In addition to modifying the existing methods, the BI lab examined what analysis, if any, should be added for small grain samples. In consultation with the Research and Development team at General Mills and other outside experts in wheat and oats, we identified the following analytes as potential options: dietary fiber (total, soluble and insoluble), the ratio of free to bound polyphenols, protein content, and tocopherols (vitamin E).
We identified a suitable protein measurement using the Lowry method and developed a process congruent with the correct extraction and dilution thresholds to add protein to the BI’s standard suite of tests for grains.
The BI lab was not able to incorporate methods for the following analytes listed because they failed to meet the “low capital cost” and “low ongoing cost” conditions of our high throughput lab processes. As our research into grains advances, we will continue to pursue process developments that would make these accessible options.
Free and bound polyphenols: the extraction and separation of protein and bound polyphenols for analysis was too complex for high throughput lab processes.
Tocopherols (vitamin E): this test requires the use of acetone and hexanes, which cannot be safely used without extraction fume hoods and other advanced equipment to ensure safe handling.
Dietary fiber: after conducting a literature review of methods, the lab determined that this would require a prohibitively high cost of instrumentation.
Methods used
Every grain sample received by the BI lab directly from farmers included one quart sized bag of grain and one quart sized bag of soil from each of two depths, 0-10 cm and 10-20 cm. Upon arriving at the lab, grain samples were divided into three subsamples which were then analyzed separately. Samples were tested for the analytes described in Table 1, and detailed documentation of all lab processes used for crop and soil samples in 2020 can be found here: BI - Lab Processes
Statistical Approaches
The BI is a large observational study that depends on individuals to submit samples and sample metadata to the lab. As such, the data is often not normally distributed, which is a requirement for many common statistical approaches. Therefore, the BI uses a combination of traditional approaches (regression, ANOVA, etc) and more novel, non-parametric methods to identify relationships between farm practices, environmental parameters, crop variety, and nutrient density outcomes.
The non-parametric methods used in this study test the values in an observational group in relation to a reference set. For example, when examining the effect of tillage intensity on outcomes, we used “no-till” as the reference category and compared how “light” and “heavy” tillage shifted the median value in relation to no-till. We consider a median shift to be significant if the p-value < 0.1, or if the 90% confidence interval did not cross 0 (the reference value). These thresholds of confidence are lower than p < 0.05, which is the standard for traditional academic research, because that level of confidence is often not feasible for on-farm research in real world settings. Furthermore, our goal is to discover trends and patterns within the dataset that are strong enough to warrant further testing, and setting overly stringent parameters would reject many potentially interesting trends.
Models to predict nutrient density outcomes from sample metadata, spectral data, and soil data were developed using multiple linear regression analysis and Random Forest, an ensemble machine learning program. To test Random Forest predictions models we use k-fold cross validation to reduce overfitting.
Sample and Data Collection
Recruitment
A key to the success of the Bionutrient Institute is engagement with partners who are willing to share granular farm management data; capturing a wide range of practices including tillage, cover cropping, amendments, irrigation, and other factors that affect soil and crop outcomes. This level of detail is critical to illuminate the links between farm management, soil health and crop nutrient outcomes. For this project, we partnered with Pipeline Foods to identify such grower partners in their network. In June 2020, Pipeline Foods staff sent out newsletters detailing the project and inviting farmers to participate, and interested producers completed an interest survey.
Forty-two farmers expressed interest in the program and received follow up communications from BI staff. After onboarding phone calls, 37 farmers joined the program. The BI provided each participant with training on how to collect grain and soil samples, and a sample packet that included pre-labelled sample bags, prepaid shipping supplies and a soil probe.
Farm Practice and Sample Data Collection
Of the 37 farmers that expressed interest, 25 were retained through the sample submission stage. Those partners submitted 123 and 241 samples of oats and wheat, respectively (Table 2). Due to the additional work of two partners who aggregated samples from multiple farms, those 364 samples were sourced from 45 farms across thirteen states. Each sample submitted by these farm partners included one grain sample and two soil samples, from 0-10 cm and 10-20 cm depths. To meet this project’s goal of 250 samples each of oats and wheat, we partnered with General Mills and a BI partner lab in France, who submitted 249 and 57 additional samples, respectively.
At harvest, program partners collected grain and soil samples from three randomly selected locations across the field. They documented their collection and details about the field in a harvest survey, then mailed the samples to the lab for processing. Upon arrival, these samples were split into three subsamples for analysis.
Each partner was expected to complete two crop management surveys, one at planting and another at harvest. For this project we modified the forms used in the 2019 BI food and soil surveys to include questions that more accurately reflect management of small grain crops.
In the three years that BI has been running the food and soil survey, we have developed effective methods for capturing granular management details from farmers. In this project, when BI staff worked directly with farmers, we were able to receive partial granular management data (at least a planting form) for 86% of the samples received. Conversely, we were not able to capture any detailed management data from partners associated with General Mills, and only 53% of French partners submitted granular management data. This outcome suggests that in future work, it is more efficient for partner organizations to help us identify interested farmer populations, and then to support the BI to use our established methodologies to collect management and sample data.

Examining the Factors That Affect Nutrient Density Outcomes
In 2018 and 2019, the Bionutrient Institute found that nutrient concentrations in produce varied widely across the food supply chain. For example, nutrient dense lettuce could have 100 times more antioxidants and polyphenols than non-nutrient dense lettuce. These variations in nutrient concentrations are the result of many factors, including the climate where the lettuce was grown, the soil in which it was grown, the cultivar of the lettuce, the farm practices used to grow it, and where the lettuce sample was sourced (i.e. a store, farmers market, or directly from a farm).
In 2019 we also found that identifying trends in nutrient density outcomes was challenging, with farm practices often affecting nutrients and minerals differently. For example, if farm practice X increases antioxidant content but decreases polyphenol content, does that farm practice increase or decrease nutrient density? To simplify interpretation of complex nutrient density data, we developed an index value that we refer to as the Bionutrient Quality Index (BQI) to aggregate multiple analytes into a single value (Box 1). This index value is our starting point for developing a practical and measurable definition for nutrient density in crops and it in no way represents scientific consensus, but is a useful placeholder that we can develop a framework around for today. Over time, we hope to engage with food scientists, nutritionists and others to modify this index value to be more precise. At the same time, we are developing a library of BQI data for small grains, fruits and vegetables that can be used to compare crops.
The first step in expanding the BI database to include small grain crops involved determining the level of variation across wheat and oat samples. If there is very little variation across grains, then there is likewise scarce opportunity to use market incentives to promote practices that increase nutrient density. Conversely, large variations within the supply chain show an opportunity to use market forces to compensate growers who produce high quality grains and promote best practices.
Similar to previous BI findings, we observed that the variation (max:min ratio) of antioxidants, polyphenols and many minerals was high, often in the range of 10x (Table 3). Protein varied by as much as 5x, which could significantly affect a farmer’s bottom line because farmers may get penalized for low protein content. The variability seen in this study, while lower than reported in produce crops, shows that there is significant opportunity to increase the nutrient concentration of the “average” wheat and oat crop. This also creates an opportunity to significantly expand the impact of the BI, because wheat and oats cover many more acres of US farmland and make up a higher percentage of the average American’s diet than the non-grain crops also included in the BI (Box 2, Appendix A).

Table 3. Median values and max:min ratio (increase in nutrition between the most and least dense grain samples) for analytes as measured by the BI lab for wheat and oats. The first set of nutrients and minerals are included in the Bionutrient Quality Index (Box 1).

Now that we have established that significant variation exists, we need to examine the sources of that variation. This task is challenging in a large observational study such as this, where the data are not normally distributed. The volunteer nature of recruitment into the program adds an additional layer of complexity, as we cannot neatly split our population into comparable groups such as no-till and tillage, as is done with more traditional research. Instead, we must first collect a large amount of metadata about each sample that arrives in the BI lab. From which climate region and soil type did the sample originate from? What was the crop variety? How was it managed? Once we have collected that data, we use sets of common and non-parametric tests to understand the sources of variability and their importance on the outcomes.
Many of these sources of variability cannot be controlled by the farmer, such as the weather or soil type, but farmers can choose which varieties to plant and have a range of options in how to manage their crops. In this way, the diversity of nutrient density outcomes provides both challenges and opportunities. However, without market incentives for higher nutrient density in food, there is little incentive for a farmer to make management changes. This is a core motivation driving the construction of the BI’s public database of nutrient density in fruits and vegetables in relation to farm management practices and other sources of variation. Such a database, as it becomes more populated, can be a driving force for consumer knowledge of nutrient density, and provide resources for farmers to improve decision-making.
We used analysis of variance to determine that both climate region and soil type (suborder) significantly impacted nutrient density (data not shown). However, the “N” was often quite small for these variables, meaning there were only a few observations from a given climate region or soil type (Fig. 1, 2). Whenever the N = 3, that indicates that there was only one field from that variable (climate region, soil suborder, crop variety), which was split into three subsamples in the lab. In these instances, it is impossible to determine if the climate region or soil type is the cause of the variation, or if the cause is related to the crop variety or management practices of those few samples. In Figures 3 and 4 we see that crop variety and wheat class may also introduce a lot of variation. However, like climate region and soil type, many varieties had only a few observations. For small grains crops like wheat and oats, the availability of crop varieties is often regional, so you will not see farmers in the Midwest and Pacific Northwest planting the same cultivars. Due to the large number of cultivars that exist for these crops, it would most likely require repeating the food and soil survey for multiple years to develop a database rich enough to help farmers choose cultivars based on nutrient density outcomes.

Figure 1. Protein levels in wheat by soil type (suborder). There is significant variation in protein content across the soil types represented in this study. Soil type is heavily influenced by climate and we expect that the variation here is related to the variation observed across climate regions

Figure 2. Protein levels by climate region. There is significant variation in protein content across different climate regions. We would need more samples from many of these regions to understand if the differences in nutrient levels are due to climate or due to crop variety or management factors.

Figure 3. Protein levels by crop variety. There is significant variation in protein content. There are only a few samples for many of the varieties analyzed by the BI lab. We would need more samples of these varieties to understand if the differences in nutrient levels are due to genetics or other environmental or management factors.

Figure 4. Protein levels by wheat class. Different classes of wheat are known to have very different protein levels so the variation displayed in this figure is expected.
Farm Practices
In recent years, food supply chain companies have shown increased interest in sourcing foods produced using practices believed to be healthier or more environmentally friendly. However, there is still little clarity on the tangible nutritional outcomes of the wide range of practices that fall under this category. As the BI and Bionutrient Institute work to develop these functional standards, we are also developing ways to conceptualize which factors are most important.
As previously mentioned, the observational and nonstandardized nature of this study makes using traditional statistical methods nearly impossible. Therefore, we use non-parametric analysis to test the “median shift” (percentage change) of individual nutrients grown under different practices compared to a reference set of samples. That reference set may be different for each set of practices, and will be described in its table or figure. In the tables in this section of the report, we have split up the results into three categories based on our level of confidence. Values in bold signify that the observed effect is more statistically likely to be real (p value < 0.1). Normal coloring indicates that the observed effect was not quite statistically significant (0.1 < p < 0.2) but was close enough to warrant follow up investigation to prove or disprove that the effect is real. Finally, light gray effects are just as likely to be caused by random chance as by farm practice and therefore should not be investigated.
Soil Disturbance
Tillage as a practice is known to destroy the continuous soil pore network and infrastructure that has been created by soil organisms. Conversely, no-till supports the activities of the soil biota, improves soil's ability to store moisture, and increases soil carbon content. Figure 5 presents the nutrient density of wheat when using light tillage (6 or less inches deep) and heavy tillage (greater than 6" deep) compared to no-till. There were not enough samples of no-till oats to be included in this analysis. For each mineral measured by the BI lab, tillage caused a large and significant decrease in nutrient density. Furthermore, in antioxidants and protein, heavy tillage caused a larger decline in nutrient density than light tillage. Tillage intensity also had a significant impact on both soil health metrics measured by the BI lab; soil carbon and soil respiration (a measure of biological activity). Both light and heavy tillage reduced soil carbon compared to no-till (Fig. 6). Conversely, soil respiration increased as soil disturbance increased, especially at the deeper soil depth increment (10-20 cm). Tillage mixes the soil, bringing organic matter into contact with soil microorganisms, often stimulating biological activity, and re-distributing organic matter throughout the plow layer. The large increase in soil respiration under heavy tillage in the 10-20 cm layer suggests that re-distribution of organic matter when crop residues were plowed into deeper soil layers caused an increase in respiration compared to no-till where the crop residues remain at the soil surface.

Figure 5. The median shift of nutrient content in wheat produced using heavy and light tillage compared to nutrient levels in no-till samples. Wheat grown under heavy and light tillage had significantly lower nutrient concentrations than samples grown in no-till systems and heavy tillage often reduced nutrient levels more than samples under light tillage.

Figure 6. The median shift of soil carbon and respiration in wheat produced using heavy and light tillage compared to nutrient levels in no-till samples. Tillage reduced soil carbon compared to no-till but increased soil respiration by mixing the soil and bringing microorganisms in contact with soil organic matter.
These results suggest that eliminating tillage increases nutrient density and soil carbon sequestration, and that more intense soil disturbance decreases both nutrient density in grains and carbon in soils. These combined effects could be strong drivers of marketplace incentives for both healthier diets and ecosystems. For this reason, it is worth taking a deeper look at the data to ensure that we are confident in the results.
Upon further examination, we discovered that all of the no-till samples arrived from the Northwest climate region (Fig. 7). Additionally, all of the samples from the Northwest were either hard red spring or hard red winter classes of wheat, which tend to have higher protein content than soft wheat classes. This clustering of no-till samples in one region makes it impossible for us to separate out the effects of climate, soil type, and wheat classes from the effects of farm practices. In 2021, we will need to pursue a broader, more balanced investigation of no-till practices. This could mean either intentionally recruiting no-till wheat samples from a wider range of climate regions across the US; recruiting tillage wheat samples from the northwest to pair with the no-till farmers we are already working with; or both.
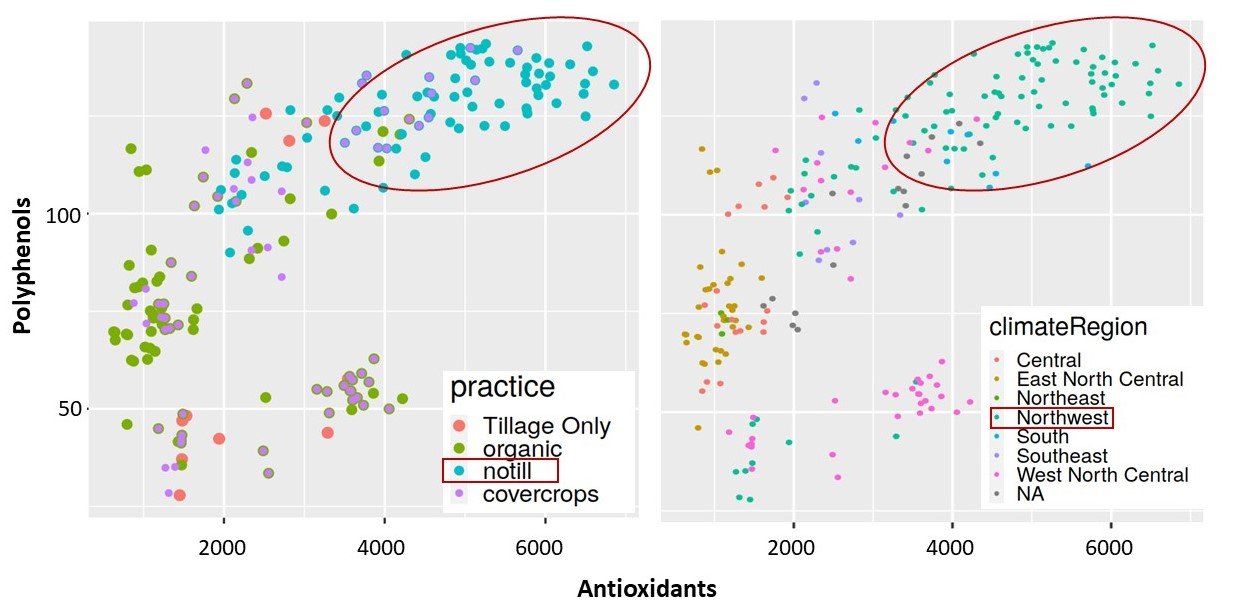
Figure 7. The relationship between polyphenol and antioxidant content in wheat by farm practice (top) and climate region (bottom). All of the no-till samples are also from the Northwest climate region. To better understand the relationship between no-till and nutrient density and soil health outcomes, the BI should actively recruit participation by no-till farmers from other regions of the US.
Farm Inputs
We have already explored how the BI database could be used as a decision support tool for farmers to select nutrient dense crop cultivars and promote marketplace incentives for practices like no-till and reduced tillage. This same database can also provide insights into which inputs and practices can increase nutrient density outcomes, giving farmers decision-making power. Table 4 presents the median shift in nutrient content in grains grown using organic and synthetic amendments compared to a reference set in which no amendments were grown. Organic amendments increased the antioxidant content in oats and the polyphenol content in wheat and oats, but decreased protein and mineral content in wheat. Conversely, using synthetic fertilizers increased antioxidant, polyphenol and most mineral content in wheat and antioxidant and polyphenol content in oats. However, using organic amendments improved soil carbon by 12 - 19% compared to not using any amendments at both soil sampling depths while use of synthetic fertilizers decreased soil respiration at both sampling depths (Table 5). These results highlight how the use of synthetic fertilizers tend to feed the crop at the expense of the soil, while organic amendments feed the soil.

Table 4. Median Shift of nutrient content in grains with organic and synthetic inputs compared to a reference set in which no amendments were used.

Table 5. Median Shift of soil carbon and respiration with organic and synthetic inputs compared to a reference set in which no amendments were used.
We did not have enough samples of wheat or oats to determine the individual effects of other farm practices, such as certified organic, cover cropping or use of companion cropping. However, by combining the soil results from both crops we could investigate the impacts of companion cropping and cover cropping on soil carbon and respiration. Companion cropping, planting oats along with another crop such as pea or a forage mix, increased soil carbon and respiration by 19-64% compared to sole cropped oats. Conversely, cover cropping resulted in 15-36% less soil carbon or respiration compared to crops that were not cover cropped. This result may be skewed by low cover crop usage in the no-till systems in the Northwest, which had good soil quality outcomes. These results further illustrate the need for more balanced collection of samples across ecosystems and farm types.

Table 6. Median Shift of soil carbon and respiration with companion crops grown compared to no companion crops and with cover cropping in the past 12 months compared to no cover cropping.
Table 7 presents the impact of different seed treatments, either by class or specific product names, on nutrient density outcomes in wheat. Fungicides and two specific products, the “Gold” and “Standard” package treatments, all had consistently positive nutrient density results. Conversely, biological and insecticide treatments had mixed results, improving some nutrients while decreasing others. Many of these treatments have relatively few observations, with the amendments only being applied on four to eight fields. However, this table demonstrates the kind of database that could be developed to aid decision making for farmers across the country. Most product information is released by the manufacturer or distributor, so providing a decision support tool developed by an independant, transparent and public organization could be a trustworthy source for farmers to get management information.

Table 7. Median Shift of nutrient content in wheat grown using different seed treatments compared to a reference set where no seed treatments were used. A database of this type can provide a tool for farmers to make decisions based on real impact, rather than sales and marketing pitches.
Soil Properties

Figure 8. Observed vs. predicted graphs for Random Forest models predicting antioxidant, polyphenol and protein content from soil parameters only. These plots show strong correlations between lab indicators of soil health and crop nutrient levels. The closer the data points align to our 1:1 prediction line (in blue) the more accurate our models were.
In 2019, the BI reported links between soil health parameters and nutrient density in crops. This aligns with the belief of many in the regenerative agriculture space that soil health drives nutrient density in crops. To directly examine this relationship we used a Random Forest model to predict nutrient concentrations in wheat and oats using only the soil health parameters measured in the BI lab (Fig. 8). Given the many sources of variation that we have shown to influence nutrient density outcomes, the R2 values ranging from 0.42 to 0.9 observed here suggest strong links between soil health and nutrient density. To further interrogate this relationship, we calculated the “variable importance” of each soil health parameter (Fig. 9). In oats, which had stronger relationships between soil health indicators and measurements of antioxidants, polyphenols and protein, soil carbon was the strongest driver of outcomes. Conversely, wheat outcomes appeared to be primarily influenced by soil respiration, not soil carbon. Soil properties are driven in part by soil type, which is related to climate region. Therefore, it is likely that some of the relationships we see here may be related to other environmental variables beyond soil health. However, the strength of the relationship does suggest that increasing soil health will improve nutrient density outcomes.

Figure 9. The importance of organic carbon, pH and soil respiration (at two depth increments) in predicting nutrient levels in wheat and oats. Each bar’s relative height signifies its importance to the model, so the two tallest bars - organic carbon percentage (20cm) in oats and soil respiration (20cm) in wheat were the most important predictors in the model in Figure 8.
Using BQI to Summarize Farm Practice Data Across Grains
In the previous section, the forces responsible for increasing nutrient density were not often clear. If a practice increased some quality measurements in wheat, it reduced the same measurements in oats. This is caused in part by a limited number of samples for any given farm practice. In order to increase statistical power when testing different practices, we combined all of our wheat and oat samples to give us a larger sample set to work with.
First, we used each sample's percentile to normalize across both crops. Effectively, this means we ranked each nutrient from lowest (score = 0) to highest (score = 100) for each crop. Thus the wheat sample with the highest antioxidant content has the same score (100) as the oat sample with the highest antioxidant content, regardless of the actual value. Next, we used the same non-parametric analysis to compare the samples to the reference median. In this case, the reference category consisted of all samples where tillage occured and no other regenerative practices (cover crops, organic, regenerative or transitioning) were listed. Figure 10 presents the effects of farm practice on all of the analytes measured. The shift (y-axis) refers to the percentile improvement of the farm practice over the reference category, and the shading of the bar represents statistical confidence. With the exception of no-till, most farm practices have highly tranparent bars (low confidence) and a mix of positive and negative shifts across different analytes, making it difficult to determine if these practices had any impact on nutrient density, either positive or negative.
The BQI (see Box 1) in grains includes antioxidants, polyphenols, protein, magnesium, sulphur, potassium, calcium, iron and zinc. In Figure g11, we present the BQI using two potential calculations. Using either calculation, no-till resulted in large and significant increases in BQI compared to the reference. However, as previously mentioned, the uneven distribution of no-till data makes drawing firm conclusions from this data difficult. Using either calculation, organic practices had a positive impact on nutrient density. Cover cropping, regenerative and transitioning practices either had a very low effect or very low confidence in the effect, regardless of the calculation used.

Figure 10. Median shift of regenerative farm practices, as identified by the producers, on nutrient content for all analytes measured in the BI lab compared to non-regenerative practices. Most of the individual analytes have very low statistical confidence, making identifying trends very difficult. Furthermore, with the exception of notill, regenerative practices show a combination of positive and negative trends, making it difficult to identify which practices increase nutrient density.

Figure 11. Median shift of regenerative farm practices, as identified by the producers, on BQI (Box 1) for all analytes measured in the BI lab compared to non-regenerative practices. The impact of no-till, while significant, needs to be examined further to understand whether region or soil type are biasing the results.
Predicting grain quality and soil carbon
Employing market incentives to reward nutrient density requires first the ability to predict that density, preferably without the expense of laboratory analytical tests. For this reason, the Bionutrient Food Association has supported the development of the Bionutrient Meter for the past three years in the hopes of developing a handheld tool capable of predicting nutrient density in crops. Such a tool would provide consumers with the information needed to make quality driven purchasing decisions, and could be a valuable resource for food supply chain actors to distinguish between high and low nutrient dense foods. At the same time, the Bionutrient Meter has been used to successfully predict soil carbon concentrations in soils, when paired with a region-specific calibrated data set. The Bionutrient Meter is low-cost ($400), handheld, 10-channel spectrometer (ranging from 365-940 nm) that connects to the SurveyStack data collection platform, allowing developers to build and deploy models that incorporate sensor data, user-entered data and publicly available data (such as from public soils repositories).
Every sample of grain, produce, or soil that is analyzed in the BI lab is also scanned with the Bionutrient Meter and Siware spectrometer. The Siware spectrometer (1300-2500 nm range, 30 nm resolution) is a benchtop device with a higher price point and different range of detection than the Bionutrient Meter. This allows us to build the spectral libraries needed to create nutrient density and soil carbon prediction models, while concurrently evaluating which tools are most cost effective and capable of developing into field deployable models.
Predicting Soil Carbon

Figure 12. Observed vs. predicted values when predicting soil organic carbon using the Bionutrient Meter and simple in-field observations. Aside from the few outliers seen at the top of the figure, predictions using the Bionutrient Meter match very closely to lab-derived data.
In this report we have seen evidence that soil carbon can impact nutrient density in grains, and there is significant interest in soil carbon as it relates to Ecosystem Service marketplaces. Therefore, building the capacity to predict soil carbon can provide multiple opportunities within the BI by incentivizing carbon increases directly through ecosystem marketplaces, promotion of carbon building practices as a means to build nutrient density in crops and possibly even as an additional factor to improve our predictions of nutrient density in grains.
Each wheat and oat sample that we received included soil samples at two depths. Additionally, we asked a few survey questions of participating farmers about each field's soil conditions (slope, relative sandiness, color of the soil). Using spectral scans and these field observations, we were able to predict soil carbon content with an R2 value of 0.566. While the R2 value is comparatively low for deploying a prediction model, the observed versus predicted graph (Fig. 12) shows that the Bionutrient Meter is mostly accurate with a handful of outliers that deviate from the trendline. Almost all of the soils in the calibration dataset range from 1-7% carbon, while numerous outliers have greater than 15% carbon. Further exploration of this trend may reveal that the Bionutrient Meter is only accurate up to a certain soil carbon threshold. Further work to optimize the model and identify the sources of outliers may help us properly constrain the model to the conditions where it is most accurate. Making these optimizations would allow us to deploy a field portable, handheld tool to predict soil carbon.
Predicting Grain Quality
Prediction models for nutrient density were developed using linear regression and the Random Forest ensemble machine learning method. Two different types of models were developed: 1) models to predict antioxidant, polyphenol and protein values and 2) models to categorize grain samples into low (0-25%), medium (25-75%) or high (75-100%) antioxidant, polyphenol, or protein content groups. These models pair reflection spectra with different sets of metadata that vary based on the amount of information that a farmer or food supply chain actor could reasonably have at their disposal.
We tested twenty different models in the original data analysis brief, but have chosen to highlight five prediction models here. A farmer or food supply chain actor running these models could open up a prediction survey in the SurveyStack app, enter the crop variety, state they live in, and some top-level management (use of no-till, cover cropping, etc), then dehull and scan whole grains.
Whole grain scan only: Dehull and scan whole grain with the Bionutrient Meter only.
Basic metadata only: Crop variety, state and top-level management data (use of no-till, cover cropping, etc).
Basic metadata and whole grain scan: Crop variety, state, top-level management, then dehull and scan whole grains.
Basic metadata, detailed management data, Soil C prediction, and whole grain scan: Crop variety, state, more detailed management data, scan soil samples to predict soil carbon, and then dehull and scan whole grains.
Basic metadata, detailed management data, and processed grain scan on the Bionutrient meter and SiWare spectrometer: Crop variety, state, top-level management data, dehull and scan the whole grain with both the Bionutrient Meter and SiWare spectrometer, then grind the sample and scan with both devices.
A few basic trends in the prediction models are readily apparent (Figure 13). The categorical predictions tended to perform better than predicting nutrients values. Adding metadata to the Bionutrient meter scans always improved the accuracy of the models. However, while the added steps of processing the grain and then scanning it with the more expensive SiWare spectrometer added some accuracy when predicting nutrient content, the benefits derived from these much more complex models did not result in a significant increase when classifying nutrients into categories.
The strong performance by the “Basic Metadata Only” model is concerning in that it could be the product of, or lead to, overfitting the model. If farm practices or crop variety are the important factors in the model, then there is a chance that a limited number of observations can have an outsized effect on the results. For example, on one hand, genetic variation is a critical driver of nutrient variability and is therefore an important variable. On the other hand, we had limited observations for most of the grain varieties in this project, so it is hard to know if those samples reflect the average nutrient density for a given variety or if they are outliers. For this reason, the Basic metadata model may perform well on the existing dataset, but deploying this model on an unknown sample could lead to wildly inaccurate results.

Figure 13. Accuracy of Random Forest prediction models using different combinations of spectral scans, sample metadata and soil information to predict antioxidant, polyphenol and protein content. Models were run to predict actual nutrient values (right) and to categorize nutrient content into 3 categories--top 25%, middle 50% and lower 25% (left). Overall, models that combined basic metadata with whole grain scans using the Bionutrient Meter (gray) performed as well, or nearly as well, as models that would require more expensive equipment and time consuming sample processing (blue) or more detailed data collection (yellow).
Deploying grain models
To guide the release of prediction models we developed a set of criteria that we could easily communicate to the community:
The models would only require data that could be easily collected by a non-scientist member of the community when they were measuring the spectra of the food with the Bionutrient meter.
We will predict the ranking of a nutrient and not its absolute value. At this early stage of model deployment it is more useful to tell a consumer where an item of food ranks in our database than to display the absolute value (ex: Kale leaf ‘X’ has 255 FRAP units of Antioxidants). This gives the community a sense of the relative quality that is easy to interpret.
We will provide the user with a value range at an 80% accuracy level. For example, a model will output a ranking (ex: 72) and a range (ex: 60 - 85). These values reflect the model's best guess of the percentile of the nutrient and the 80% confidence range (we are 80% confident the value falls within the given range).
The maximum allowable average value range, or width, was set to 35%. Therefore, any model whose width was greater than 35 at the 80% accuracy threshold will not be deployed.
Based on the criteria laid out above, using models including only the whole grain scans, we developed nutrient prediction models for wheat and oats. These models can be run by anyone using the Bionutrient Meter using the survey available here. Figure 14 (left) presents the crop nutrient models that were deployed as beta (test) models, as well as the range of the predictions. Figure 14 (right) is a screenshot of the nutrient estimate report that is generated using the Bionutrient meter.

Figure 14. Left: The width (+/- percentile range) for each prediction model deployed in August 2021 using the Bionutrient Meter at 80% accuracy. Right: Prediction Model output using the bionutrient.surveystack.io app to run the Bionutrient meter. The number is the predicted ranking, meaning that the sample has more polyphenols than 66% of the samples submitted to the BI labs for that crop type. The width represents the +/- accuracy range at 80% accuracy.
Conclusion
In partnership with Pipeline Foods, the Bionutrient Institute analyzed 670 wheat and oat samples, with over half of those samples coming directly from Pipeline farm partners who also provided detailed management data and soil samples. With these samples, the BI has expanded its public library of nutrient density outcomes to include wheat and oats. This represents a significant increase in potential impact for the Bionutrient Institute, as these crops total significantly more acreage of total US cropland than those previously included in the BI, as well as comprising a larger percentage of the average American’s diet.
Nutrient density analysis of these samples revealed large variation in wheat and oat quality across the US food supply chain, with protein and other nutrients and minerals increasing 5 to 10 fold in high quality grains relative to low quality grains. This variation provides an opportunity for market-based solutions that incentivize producers to increase nutrient density in their crops. While this study was not able to conclusively separate out all of the sources of variation in nutrient density, it did identify environmental factors (climate and soil type), genetic diversity, and farm practices as meaningful sources of variation. Significantly, we found that practices that are thought to be destructive to soil health, like intensive tillage, reduced both nutrient content in grain and soil carbon content. Conversely, practices that are considered to be more regenerative, like no-till and using organic inputs instead of synthetic fertilizers, resulted in increased soil carbon content or soil respiration. These two parameters also showed a significant positive relationship to nutrient density outcomes in wheat and oats.
aken together, the results of this study provide evidence that practices that increase ecosystem services can also increase nutrient density outcomes. However, operationalizing these findings into market-based incentives requires developing low-cost ways of predicting carbon in soil and nutrient density in grains. Using the Bionutrient Meter, we were able to develop and deploy basic prediction models to estimate nutrient density in wheat and oats. However, the dataset on which we developed these models is not complete enough to provide high-quality, extremely predictive models of nutrient density and further optimization is needed. To do that, we need to expand our data library to include no-till samples from across the US, and more tillage samples from the northwest. We also need to increase our sample set to include both more crop varieties and similar varieties treated with different inputs, in order to appropriately separate out how much each of these factors impact nutrient density and predictions.
By repeating this program again in 2021, we can specifically target the areas where sample distribution was uneven. This would allow us to more efficiently expand our knowledge base of inputs, practices and varieties, and their effects on nutrient density. Once we reach a critical level of information covering most relevant areas and practices, this library could be a rich source of decision support for farmers across the country, and help inform the structure of market-based incentives.
Next Steps & Recommendations
Based on the conclusions above and the areas where we found potential improvements in our experimental design or final dataset, we have identified some recommended next steps:
Build and expand the nutrient density library for wheat and oats by continuing to collect and analyze management data and grain and soil samples from across the US. Additionally, target recruitment of grower partners to fill in the management and data gaps identified in this report.
Recruit wheat growers more intentionally to receive no-till samples from a wider array of climate regions and soil types across the US, and solicit more samples from tillage systems in the Northwest climate region.
Increase the soil parameters measured by the BI lab to more deeply investigate the relationship between soil health and nutrient density.
Further investigate the relationship between soil health parameters and nutrient density by expanding the soil health data collected on BI samples.
Deploy and test the soil carbon and nutrient density prediction models developed in this study. This includes extending the small grains program to add a subset of participating farmers who would deploy these models in the field, then evaluate model performance against BI lab tests.
Expand and optimize nutrient density and soil carbon models to include publicly available soils data from the SoilGrids or SSURGO databases as factors in the prediction models.
Appendix A
2020 USDA estimates of the acres planted and harvested for each crop included in the BI Food and Soil Survey.

IN PROGRESS:
We are engaging with experts across numerous scientific disciplines, whose feedback will help us improve the analysis and interpretation of the 2020 data and the BI nutrient density library as a whole.
This means that there may continue to be revisions to this report.