
Our Research
The science behind the standard
Everything the Bionutrient Institute stands behind rests on evidence we gather ourselves. We run original, observational research across the real food supply, collecting enough data on soil, crops and management that patterns can emerge rather than be assumed, and we keep the results in the public domain. Here is how the work fits together.
The Programme at a Glance
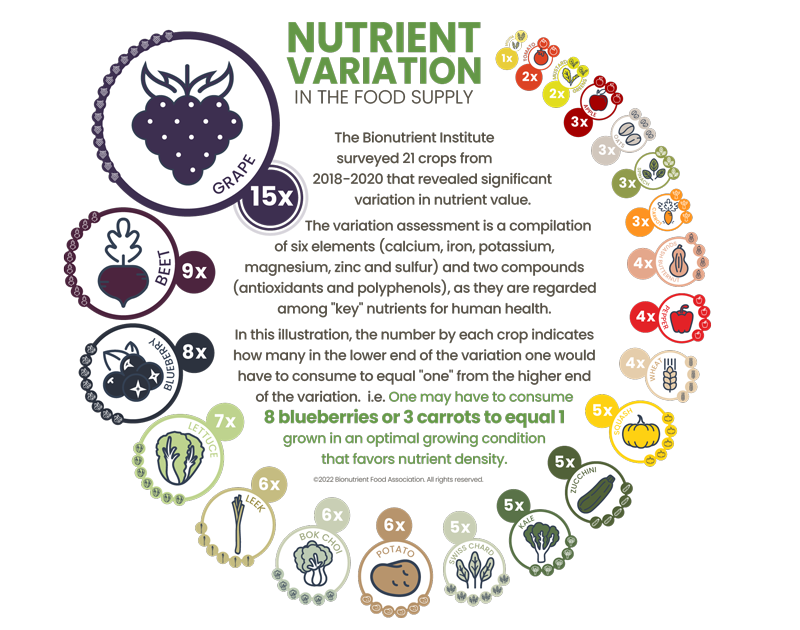
The Variation Study
Our foundational survey of how much nutritional quality varies in everyday food, and what drives it. More than 10,000 samples showed differences of many times over within the same crop, that most food sits at the low end of what is possible, and that soil health, not labels, is the strongest predictor. This is the why behind everything else.
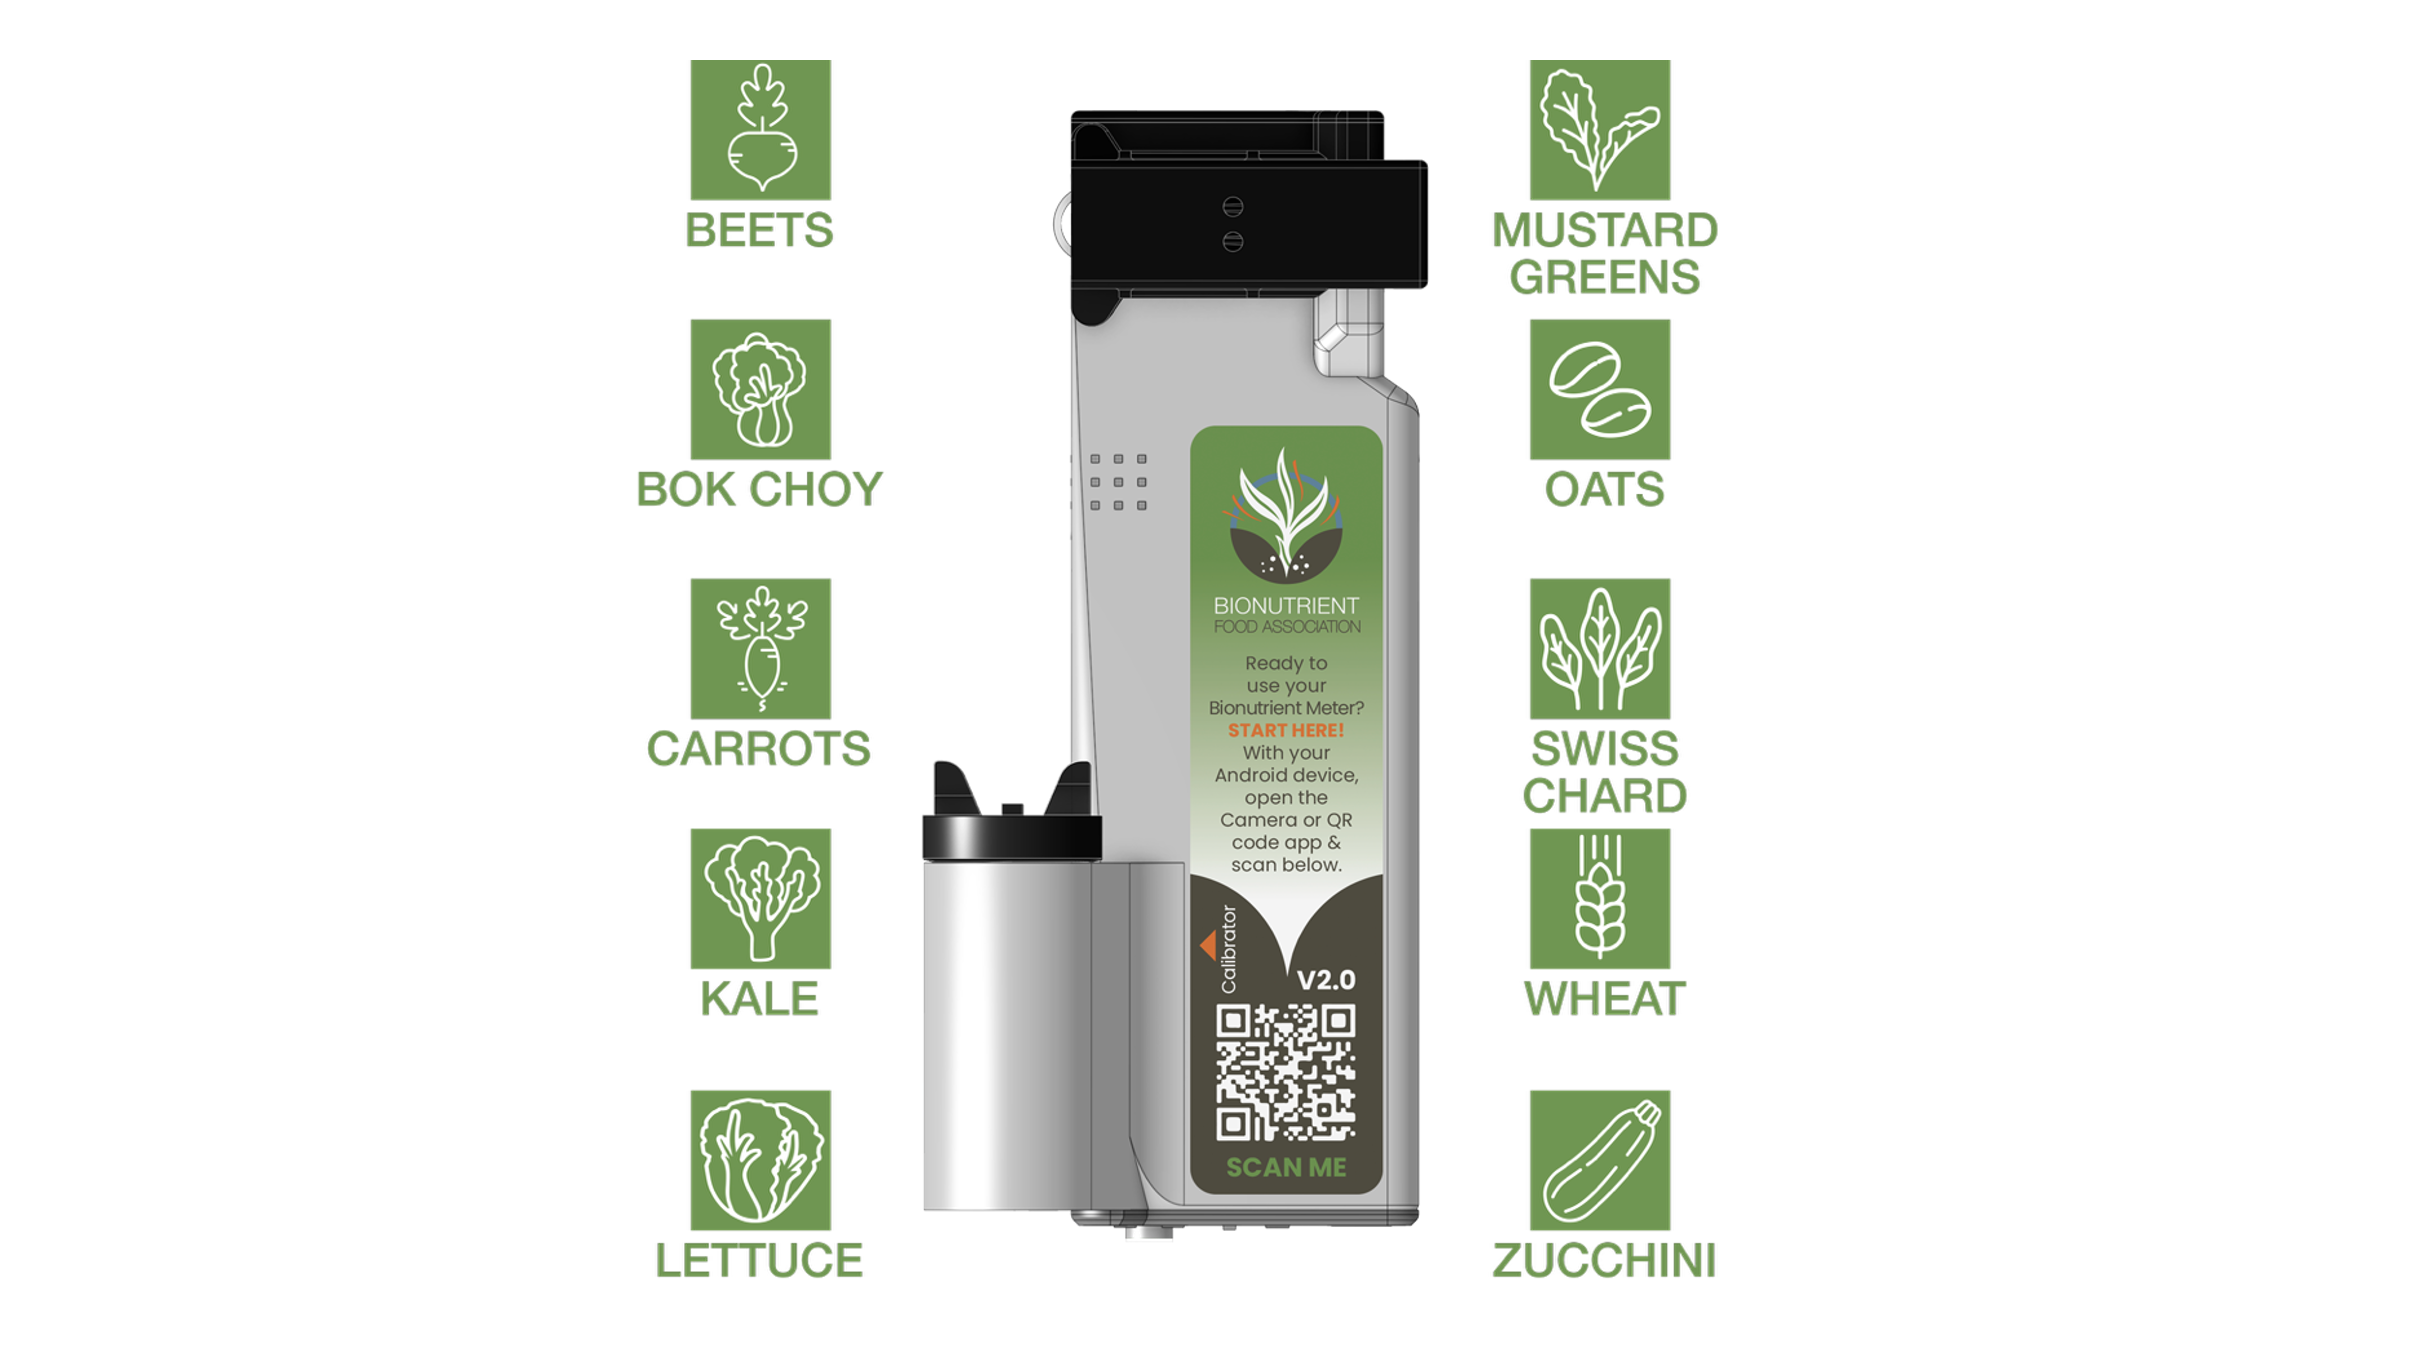
The Bionutrient Meter
A low-cost, handheld way to read food quality, the prototype that proved rapid, non-invasive measurement is possible. Its validation was published in the Nature Portfolio journal Scientific Reports in 2024. The Institute defines the standard; industry builds the meters that measure against it.

Our peer-reviewed papers and open research reports, freely accessible. We publish in leading scientific journals and share the underlying data.
Reports and Publications
Defining nutrient density, crop by crop
Our flagship work: establishing a 1 to 100 nutrient density standard one crop at a time. Beef was the proof of concept, narrowing close to a thousand candidate indicators down to a small set of biomarkers across farms on four continents. Wheat is now underway across 300 to 400 fields worldwide, with further crops to follow.

Explore the data
You do not have to take our word for it. The Data Explorer lets you dig into the findings yourself, nutrient by nutrient and factor by factor.
By the data
10,000+
Samples Analyzed
22
Crop categories studied
Abstract:
Diets consisting of greater quantity/diversity of phytochemicals are correlated with reduced risk of disease. This understanding guides policy development increasing awareness of the importance of consuming fruits, grains, and vegetables. Enacted policies presume uniform concentrations of phytochemicals across crop varieties regardless of production/harvesting methods. A growing body of research suggests that concentrations of phytochemicals can fluctuate within crop varieties. Improved awareness of how cropping practices influence phytochemical concentrations are required, guiding policy development improving human health. Reliable, inexpensive laboratory equipment represents one of several barriers limiting further study of the complex interactions influencing crop phytochemical accumulation. Addressing this limitation our study validated the capacity of a low-cost Reflectometer ($500) to measure phytochemical content in selected crops, against a commercial grade laboratory spectrophotometer. Our correlation results ranged from r2 = 0.81 for protein in wheat and oats to r2 = 0.99 for polyphenol content in lettuce in both the Reflectometer and laboratory spectrophotometer assessment, suggesting the Reflectometer provides an accurate accounting of phytochemical content within evaluated crops. Repeatability evaluation demonstrated good reproducibility of the Reflectometer to assess crop phytochemical content. Additionally, we confirmed large variation in phytochemical content within specific crop varieties, suggesting that cultivar is but one of multiple drivers of phytochemical accumulation. Our findings indicate dramatic nutrient variations could exist across the food supply, a point whose implications are not well understood. Future studies should investigate the interactions between crop phytochemical accumulation and farm management practices that influence specific soil characteristics.
4
Partner laboratories
Abstract:
Beef’s fatty acid and mineral profile is influenced by finishing diets, yet the nutritional variability within both grass- and grain-fed beef samples from commercial operations remains underexplored. Understanding potential differences is important for producers and consumers. This study profiled grass- and grain-fed beef from commercial North American producers and retailers, and evaluated relationships among grazing practices, forage quality, soil characteristics, and beef fatty acid and mineral composition. Beef samples (grass-fed, n = 253; grain-fed, n = 84), along with forage and soil samples where possible, were collected from 108 commercial producers and retailers. Fatty acids were analyzed using gas chromatography-flame ionization detection (GC-FID), and minerals were quantified using inductively coupled plasma atomic emission spectroscopy (ICP-AES). Statistical models evaluated differences and correlations between and within finishing practices using Welch’s t-test and Pearson’s correlation analysis. Grass-fed beef had a lower omega-6:3 ratio (2.14 vs. 8.28, P < 0.001) and higher concentrations of the fatty acids alpha-linolenic acid (ALA; 0.99 vs. 0.27%), eicosapentaenoic acid (EPA; 0.28 vs. 0.07%), docosapentaenoic acid (DPA; 0.41 vs. 0.17%), conjugated linoleic acid (CLA; 0.49 vs. 0.31%), and the minerals calcium (9.26 vs. 3.08 mg/100 g), copper (0.253 vs. 0.129 mg/100 g), iron (2.29 vs. 1.92 mg/100 g), and selenium (0.012 vs. 0.002 mg/100 g) compared with grain-fed beef (all P < 0.05). However, considerable nutritional variation exists, particularly within grass-finished beef, with omega-6:3 ratios ranging from 0.62 to 11.45. Animals finished on biodiverse pastures exhibited fatty acid profiles characterized by higher omega-3 to total polyunsaturated FA content, resulting in a higher omega balance (r = 0.30, P = 0.02). However, some grass-fed samples, particularly several retail-purchased samples, displayed fatty acid compositions with relatively low omega-3 content, resulting in an omega balance similar to grain-fed beef. These findings highlight the need for clearer guidance on “grass-fed” management definitions and more transparent labeling that reflects measurable nutritional attributes, such as omega-3 content, omega-6:3 ratio, and/or omega balance.
OUR LABS AND PARTNERS

Utah State University
Center for Human Nutrition Studies


Chico State University
Regenerative Agriculture Program
Bleu Blanc Coeur
France

Our Sci
Ann Arbor, Michigan
How we work
Original and observational: we gather primary data rather than reanalyse other people's. Open by default: our standards, data and methods live in the public domain. Peer-reviewed: our methods are validated and published. Collaborative: a global network of farmers, citizen scientists, universities and partner laboratories makes the scale possible.
Get involved
The research only advances with partners: farmers who contribute samples, scientists who sharpen the method, and funders who make each crop study possible.